
Farm Loan Interest Rate Trends by Major Lender Groups
![]() by Moneyofficeteam 14 February 2024 · Loans
by Moneyofficeteam 14 February 2024 · Loans
After many years of low to moderate interest rates, producers and lenders today are voicing concern about sustained higher rates and their effect on farm businesses. Starting in March 2022, as part of an effort to reduce the inflation rate to its long-term 2 percent target, the Federal Reserve began raising the federal funds rate. Increases in the federal funds rate increase farm borrowing costs, with year-over-year change in operator interest expenses rising 24 percent from 2021 to 2022 and 43 percent from 2022 to 2023 (USDA-ERS 2023). We begin this series on differences in interest rates across lenders, farm types and regions by examining historic trends in interest rates on newly originated farm debt by major lender groups.
Limited data are available to compare the variation in interest rates charged by different lender groups to farms. Our analysis uses data from the Agricultural Resource Management Survey (ARMS), a nationally representative survey of farm operations. ARMS collects loan-level information on outstanding farm debt for operations’ largest five loans. It captures information such as interest rates, loan duration, loan type, loan origination year, as well as lender characteristics[1]. For years 2008 to 2022, we apply ARMS survey weights to estimate median interest rates on newly originated real-estate and short- and long-term non-real estate debt for three groups of lenders: the Farm Credit System (FCS), commercial banks (hereafter, simply banks) and vendors[2],[3]. Medians are reported instead of averages to mitigate the influence of outliers in the data. To aid in interpreting the data, we also estimated whether interest rates for each debt type in each year were statistically different across lenders.[4] The interest rates reported in this analysis do not explicitly control for differences in borrower risk or funding costs but do provide novel insights into broad trends observed during the past 15 years.
Median interest rates for short- and long-term non-real estate debt are shown in Figures 1 and 2, respectively. Short-term non-real estate debt typically funds production expenses, while long-term non-real estate debt typically finances machinery, equipment, and breeding stock. Changes in interest rates charged by the different lender groups correlate positively with changes in the effective federal funds rate (EFFR), a volume-weighted median of overnight federal funds transactions (Federal Reserve Bank of New York 2023). During all years, either FCS loans or vendor loans had the lowest median interest rate; the average difference in median interest rates between FCS lenders and vendors equaled 54 basis[5] points. For FCS and banks, the average difference in median interest rates is 52 basis points. However, this difference narrowed in recent years. Interest rates were not statistically different between banks and FCS lenders for four out of six years between 2017 and 2022. This may be related to the relatively low interest rate environment prior to March 2022. The number of vendor observations in this category is relatively low, and interest rates charged by vendors are not statistically distinguishable from rates charged by other lenders in most years.
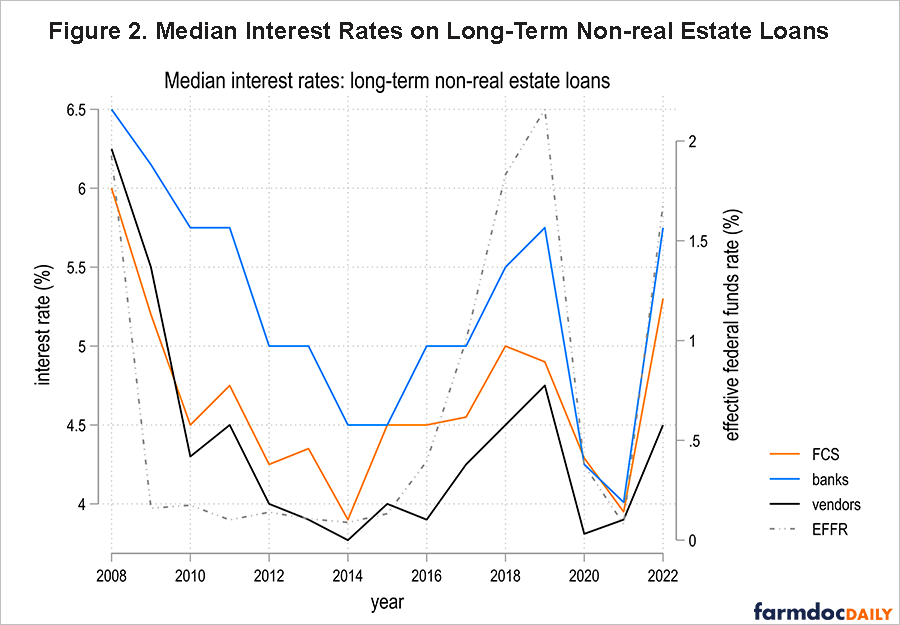
For long-term non-real estate debt, median interest rates charged by vendors were the lowest in most years, followed by rates charged by FCS lenders and then banks. The difference in median interest rates between vendors and FCS lenders averaged 35 basis points, and the difference between vendor and bank rates averaged 84 basis points. Vendors often offer lower interest rates as part of a marketing or pricing strategy, and when it comes to machinery lending, equipment dealers and manufacturers have several advantages. As a point of reference, we compare our interest rate estimates on short- and long-term non-real estate debt issued by banks to those provided by the Kansas City Federal Reserve with its national Survey of Terms of Bank Lending to Farmers. We find that our estimates of median bank interest rates on short- and long-term non-real estate debt are on average 93 and 86 basis points higher than the median interest rate on all non-real estate debt reported by the Kansas City Federal Reserve (2023).[6] This difference may be due to the different respondent groups – with the Kansas City Federal Reserve’s data based on a sample of banks rather than farms – however, both sets of data follow similar trends over time.
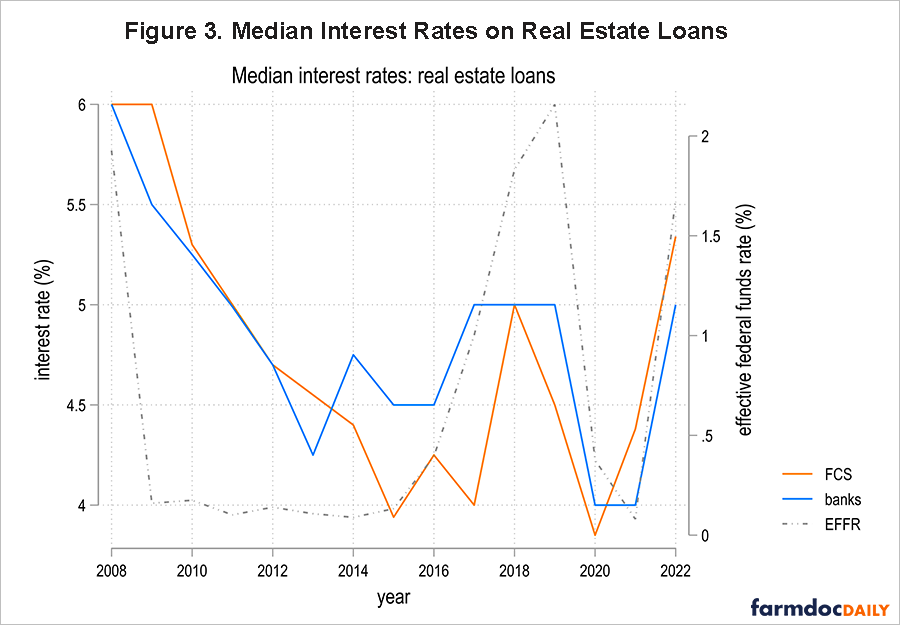
Median interest rates on real estate loans issued by FCS lenders and banks are shown in Figure 3[7]. The difference in rates between the two lender groups is generally quite small — on average, 29 basis points — and average interest rates were only statistically different in two years. For both banks and FCS lenders, median interest rates on real estate loans reached record lows in 2020. These trends suggest greater competition based on interest rates for real estate loans than non-real estate loans. As part of a government-sponsored enterprise, FCS lenders have some tax and other advantages in real estate-backed lending. However, given the cooperative structure of FCS lenders and their use of patronage payments, interest rates may not reflect the full cost of borrowing.[8] Likewise, banks may benefit from access to the secondary market — for example, competitive rates provided by Farmer Mac and other secondary lenders.
Conclusion
Median agricultural loan interest rates vary over time as underlying market rates adjust. Further, the difference in median rates charged by major lender groups varies over time. Although FCS lenders and vendors have lower median interest rates on short-term and long-term non-real estate loans than banks do, median FCS and bank interest rates on real estate loans are comparable. This analysis does not account for differences in geographic lending patterns, borrower characteristics or operation type[9]. In the next article in this series will compare median interest rates across regions, lenders and loan types.
Disclaimer: The findings and conclusions in this presentation are those of the authors and should not be construed to represent any official USDA or U.S. Government determination or policy.
Acknowledgements: This work was supported in part by effort from the Rural and Farm Finance Policy Analysis Center (RaFF) at the University of Missouri. The Rural and Farm Finance Policy Analysis Center (RaFF) at the University of Missouri aims to help policymakers and stakeholders understand rural economic and financial conditions and trends and explore how existing and proposed policies affect rural and farm finances. Alice Roach provided feedback and editorial support.
Notes
[1] ARMS data are confidential. USDA and other researchers have limited access. In the case of refinanced debt, ARMS treats the loan origination year as the year in which refinancing occurred. The survey typically asks for detailed information on an operation’s five largest loans. We cannot differentiate this loan data into fixed rate and variable rate loan categories over the entire study period.
[2] In 2022, the Farm Credit System (FCS) held a 49% market share in real estate debt and 39% in non-real estate debt, whereas banks held a market share of 32% and 42%, respectively (USDA-ERS 2023). Vendors include various forms of trade credit, including input suppliers, implement dealers, co-ops and other merchants.
[3] During the observed period, the total number of observations varied by lender category; 37,571 bank observations, 17,829 FCS observations and 7,041 vendor observations. Other lender types had fewer observations and thus were not included in this analysis.
[4]Adjusted Wald tests were used to evaluate, for each year in the ARMS data, whether average interest rates for pairs of lenders were equivalent. The tests were conducted for each loan type (short-term non-real estate, long-term non-real estate and real estate) analyzed.
[5] 100 basis points is 1 percentage point; for example, an increase in interest rates from 3% to 4% would be an increase of 100 basis points.
[6] The Survey of Terms of Bank Lending to Farmers does not break out debt by duration (short- vs. long-term) and is restricted to banks.
[7] Due to the low amount of real estate lending by vendors reported in ARMS, we omit providing interest rate estimates for this group. Real estate debt includes the operator’s dwelling.
[8] FCS lenders are structured as cooperatives. Thus, borrowers become cooperative members and are eligible to receive annual patronage payments. The net cost of borrowing from an FCS lender would account for interest rate and patronage payments.
[9] Our analysis uses data that is restricted to newly originated debt in the survey year. The interest rate data we present should be interpreted as trends rather than official estimates.